


| Source: Date: Updated: |
ChartoftheDay.com
Monday, May 21, 2012 Monday, May 21, 2012 |
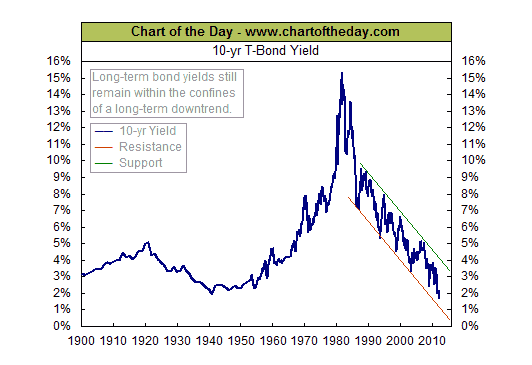
For some perspective on all-important long-term interest rates, today’s chart illustrates the 112-year trend of the 10-year Treasury bond yield (thick blue line). Escalating concerns over Europe in addition to a struggling global economy have encouraged investors, institutions and governments alike to move a portion of their investment dollars to the relative safety of the US. This has resulted in a significant decline of the 10-year Treasury bond yield. In fact, the 10-year yield has declined a fairly dramatic 340 basis points (i.e. 3.4%) since the peak of the credit bubble. This decline has brought the 10-year Treasury bond yield to a 112-year low. The decline of the 10-year Treasury bond yield has been significant enough to bring the 10-year yield near resistance of what is a 26-year downtrend channel.
This is an excerpt from ChartoftheDay.com as it appeared on May 21, 2012. For updates or to read the current version of this post in its entirety, please click here.
Continue reading this post >

