


| Source: Date: Updated: |
Chart of the Day
Friday, January 18, 2013 Friday, January 18, 2013 |
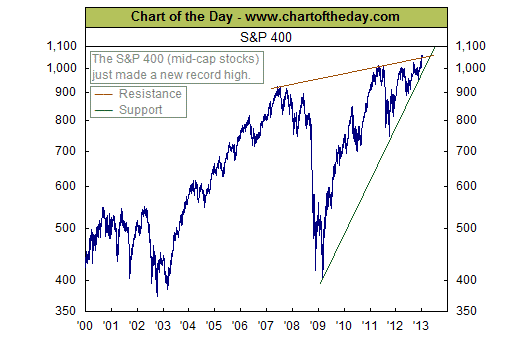
This chart presents the long-term trend of the S&P 400 (mid-cap stocks). As the chart illustrates, the S&P 400 rallied from late 2002 into the mid-2007 and then gave most of that back during the financial crisis. However, the S&P 400 rebounded well by recouping all losses incurred during the financial crisis and making new record highs in a mere two years.
This is an excerpt from Chart of the Day as it appeared on January 18, 2013. For updates or to read the current version of this post in its entirety, please click here.
Continue reading this post >

