


| Published: Date: Updated: Author: |
The Bahamas Investor Magazine July 1, 2013 July 1, 2013 Steve Cotterill |
This year has seen the US stock market continue to rally, particularly through April and May, with the S&P 500 reaching highs not seen since the peaks of 2000 and 2007. Widely regarded as the best single gauge of the large cap US equities market, the S&P index has more than US$5.58 trillion benchmarked, with index assets comprising approximately US$1.31 trillion. The index includes 500 leading companies in major industries of the US economy, capturing 75 per cent coverage of US equities, as compared with the Dow, which consists of just 30 stocks.
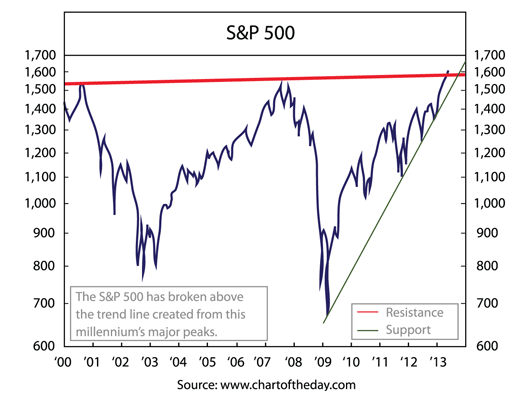
To put recent gains in perspective, it is worth looking at how the index has battled resistance since the turn of the millennium (see chart).
Fuelled by the dot.com boom and a string of Internet-led IPOs, on March 24, 2000, the S&P 500 closed at an all-time high of 1,527.46. For the next two years, however, it fell, as the IT bubble collapsed and shock waves from the 9/11 terror attacks on the US continued to ripple through the global investment community. The index bottomed in October 2002.
As the chart illustrates, the S&P index then rallied, posting persistent gains through to the fall of 2007. On October 13 of that year, the S&P 500 marked its best daily percentage gain, rising 11.58 per cent. It also registered its largest single-day point increase of 104.13 points, giving no indication of the perfect storm about swallow the global economy.
In 2008, the index fell 38.49 per cent, its worst yearly percentage loss as Lehman Brothers collapsed and the financial crisis spread. By March 9, the S&P 500 closed at a decade low of 676.53.
From that point, the index gradually recovered, supported by such blue chip companies as Apple, which became the biggest US company and took over as the market capitalization leader in the S&P 500 August 20, 2012, pushing Exxon Mobil into the No 2 spot.
Spring 2013 saw the index rebound further, repeatedly posting intra-day highs spurred by a shift from government and corporate bonds to stocks, exchange-traded funds (ETFs) and other funds with a basket of stocks. In May, the index broke through the resistance level set by the two previous peaks, recording a high of 1,658.78 May 15, although in real terms this may be below the high tide marks of 2000 and 2007 as the index does not account for inflation. The likelihood is that there will be market adjustment over the coming months, but recent gains bode well for investors barring unforseen developments.
Sources include S&P Dow Jones Indices senior index analyst Howard Silverblatt, Standard & Poor’s, CME, Chicago Board Options Exchange, Vanguard Group Inc, State Street Global Advisors, and Caroline Valetkevitch (Reuters)

