


| Source: Date: Updated: |
Chart of the Day
Thursday, August 1, 2013 Thursday, August 1, 2013 |
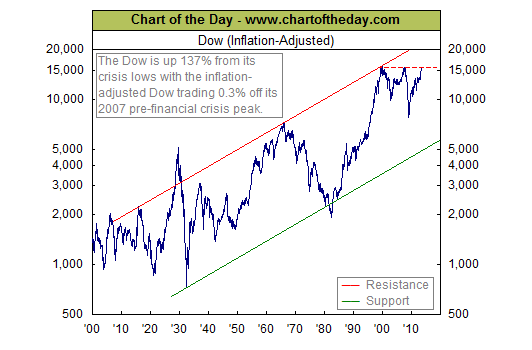
As the stock market continues to trade in all-time record territory, today’s chart provides some perspective by illustrating the inflation-adjusted Dow since 1900 — there are several points of interest. For one, while all major US stock market indices trade well within record territory, when adjusted for inflation, the story changes. For example, the inflation-adjusted Dow still trades below both its 1999 and 2007 peaks — albeit not by much (only 0.3% below its 2007 pre financial crisis peak and 2.7% below its 1999 all-time, inflation-adjusted record high). Another point of interest is how the inflation-adjusted Dow has not spent much time above the low 15,000 level (see red dashed line).
Source: Chart of the Day.

