| Source: Date: Updated: |
Chart of the Day
Wednesday, March 6, 2013 Wednesday, March 6, 2013 |
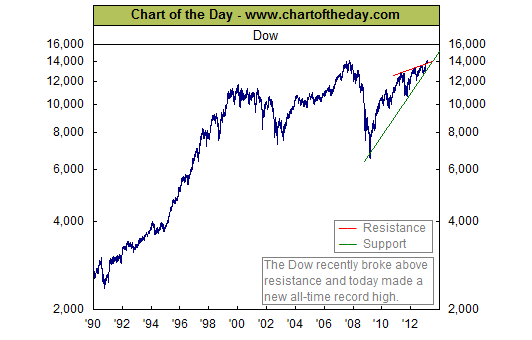
As the chart illustrates, the stock market has been especially volatile as it navigated through a couple of historic boom bust cycles (i.e. dot-com boom and bust of 1995-2002 followed by the credit boom and bust of 2002-2009). As for the post-financial crisis rally, it stands out for the obstacles that it had to overcome (e.g. housing market plunge, near financial meltdown, European sovereign debt crisis, etc.) with the Dow still being able to more than double since its March 2009 low. All in all, it has been an impressive and resilient performance.
Source: Chart of the Day


