


| Source: Date: Updated: |
Bahamas International Securities Exchange
Tuesday, May 9, 2017 Tuesday, May 9, 2017 |
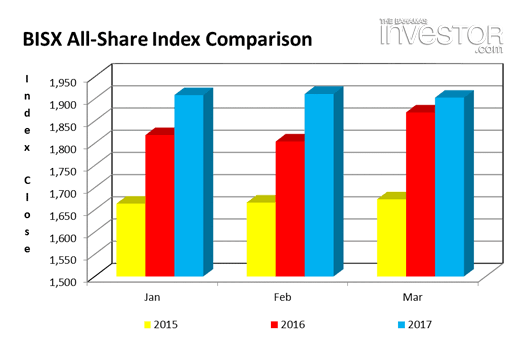
BISX is pleased to announce its BISX All-Share Index and trading statistics for the three-month period ending March 31, 2017 with comparison to the same period of 2016.
BISX ALL SHARE INDEX
For the three-month period ending March 31, 2017 the BISX All-Share Index closed at 1,902.75. This represents a year to date decrease of -33.46 or -1.83%. By comparison for the three-month period ending March 31, 2016 the BISX All-Share Index closed at 1,873.96. That increase was a year to date increase of 50.01 or 2.74%. The BISX All-Share Index is a market capitalization weighted index comprised of all primary market listings excluding debt securities.
As at March 31, 2017 the market was comprised of 20 ordinary shares with a market capitalization of $4.041 Billion. In addition, there were 13 preference shares with a market capitalization of $327 million and 19 bonds with a face value of $579 Million.
COMPARISON OF BISX ALL SHARE INDEX TO INTERNATIONAL INDICES
Over the three-month period January 1 to March 31, 2017, some international equity markets have experienced increases as indicated by the chart below:
| Closing Date | MSCI Emerging Market Index[1] | S&P 500 Index[2] | FTSE 100 Index[3] | BISX All Share Index |
| Jan 3, 2017 | 868.44 | 2,257.83 | 7,177.89 | 1,938.21 |
| Mar 31, 2017 | 958.37 | 2,362.72 | 7,322.92 | 1902.75 |
| Percentage Change (+/-) | 10.36% | 4.65% | 2.02% | -1.83% |
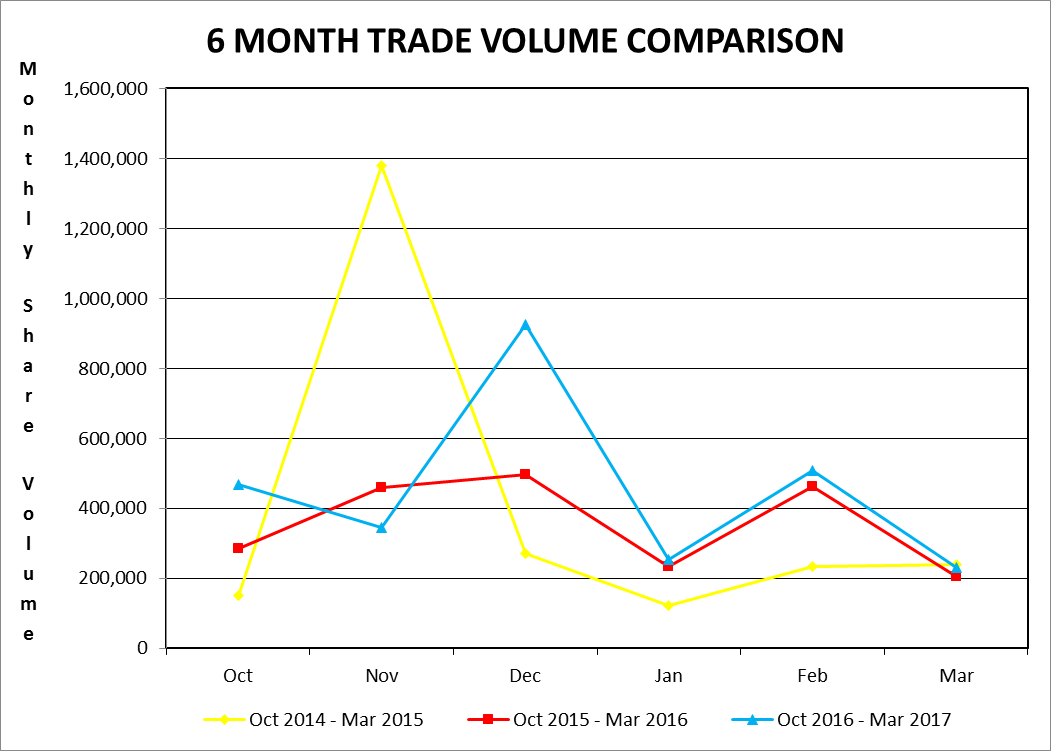
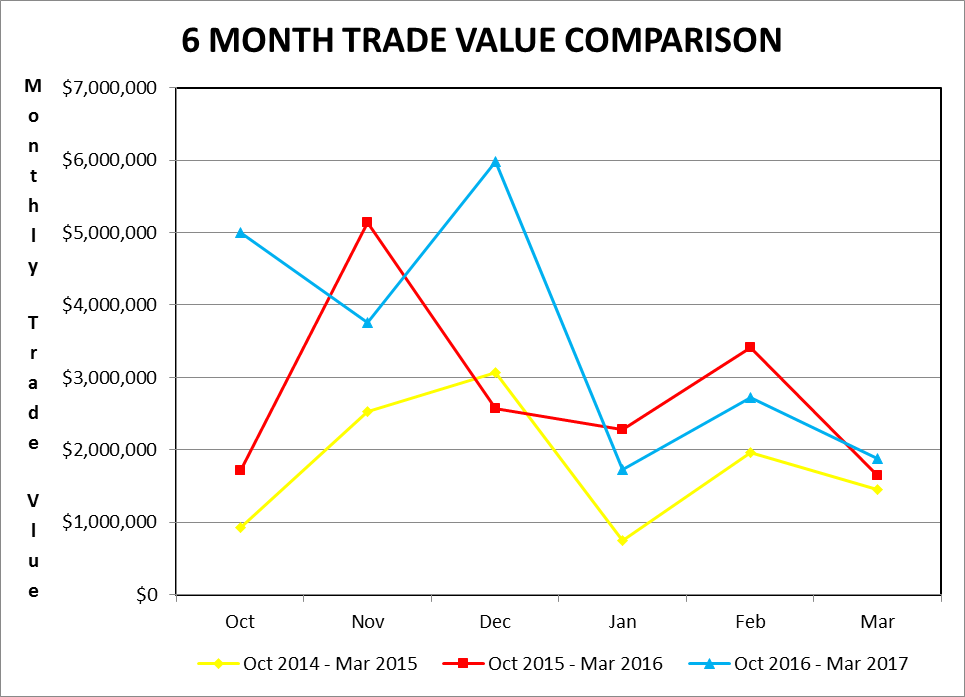
TRADING VOLUMES AND VALUES
Trading volume for the three-month period January 1, 2017 to March 31, 2017 was 996,137 shares for a value of $6,314,569. By comparison, trading volume for the three-month period January 1, 2016 to March 31, 2016 was 899,125 shares for a value of $7,337,430.
AVERAGE DAILY VOLUME AND VALUE
For the three-month period from January 1, 2017 to March 31, 2017, the average volume per trading day was 16,097 shares for a value of $ 303,499. By comparison, for the three-month period from January 1, 2016 to March 31, 2016, the average volume per trading day was 14,457 shares for a value of $118,280.
| Month | Avg. volume / trading day (2017) | Avg. volume / trading day (2016) | Avg. value / trading day (2017) | Avg. value / trading day (2016) |
| January | 12,721 | 11,672 | $86,070 | $114,183 |
| February | 25,474 | 21,979 | $135,900 | $162,333 |
| March | 10,097 | 9,720 | $81,530 | $78,322 |
| Average for period | 16,097 | 14,457 | $303,499 | $118,280 |
SHARE VOLUME AND VALUE LEADERS (THREE MONTH PERIOD)
The top five share volume leaders on BISX for the three-month period January 1, 2017 to March 31, 2017 with their contribution to total traded volume displayed as a percentage were:
| SYMBOL | TRADE VOLUME | % OF VOLUME |
| AML | 519,639 | 53% |
| CAB | 153,581 | 16% |
| FCL | 91,336 | 9% |
| CBL | 75,255 | 8% |
| FIN | 26,035 | 3% |
The top five share value leaders for the three-month period January 1, 2017 to March 31, 2017 with their contribution to total traded value displayed as a percentage were:
| SYMBOL | TRADE VALUE | % OF TRADE VALUE |
| AML | $2,276,019 | 36% |
| FCL | $838,205 | 13% |
| CBL | $789,200 | 12% |
| CAB | $672,946 | 11% |
| BG0407 | $500,000 | 8% |

