| Source: Date: Updated: |
Chart of the Day
Thursday, April 11, 2013 Thursday, April 11, 2013 |
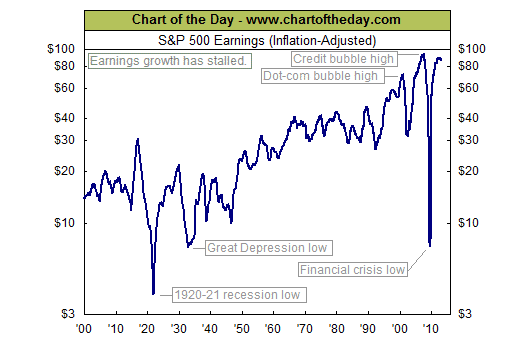
Today’s chart illustrates the trend of 12-month, as reported, inflation-adjusted S&P 500 earnings from 1900 until today. There are several points of interest… For one, while there have been several major declines over the past 113 years, it is the recent financial crisis which resulted in the greatest plunge in corporate earnings. Also of interest is how earnings have tended to rebound rather sharply following a massive decline (e.g. following the 1920-21 recession, following the Great Depression, and following the financial crisis). It is worth noting, however, that inflation-adjusted earnings are currently lower than where they were 16 months ago.
Source: Chart of the Day


