


| Source: Date: Updated: |
Chart of the Day
Friday, November 1, 2013 Friday, November 1, 2013 |
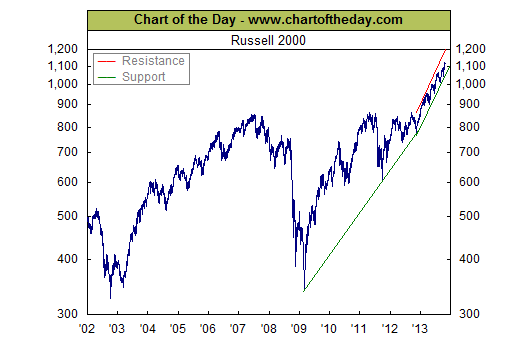
For some perspective on the current state of the stock market, today’s chart presents the long-term trend of the Russell 2000 (small-cap stocks). As the chart illustrates, the Russell 2000 rallied from late 2002 into the mid-2007 and then effectively gave all of that back during the financial crisis. The seesaw continued during the immediate aftermath of the financial crisis with the Russell 2000 recovering all losses incurred during the financial crisis in a little over two years. Beginning in November 2012, the pace of the overall trend picked up to where it currently trades with in a relatively steep and narrow upward trend channel within which it continues to make new record highs.
Source: Chart of the Day.

