| Source: Date: Updated: |
Chart of the Day
Thursday, January 31, 2013 Thursday, January 31, 2013 |
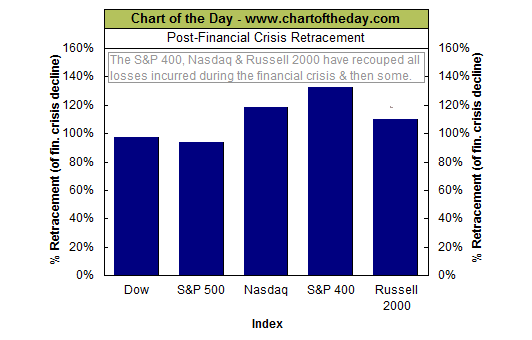
For some perspective on the post-financial crisis rally, today’s chart illustrates how much of the downturn that occurred as a result of the financial crisis has been retraced by each of the five major stock market indexes. For example, the Dow peaked at 14,164.53 back in October 9, 2007 and troughed at 6,547.05 back on March 9, 2009. The most recent close for the Dow is 13,954.42 — it has retraced 97.2% of its financial crisis bear market decline. As today’s chart illustrates, each of these five major stock market indices have retraced over 90% of their financial crisis decline. However, it is the S&P 400 (mid-cap stocks), the tech-laden Nasdaq and the Russell 2000 (small-cap stocks) that have recouped all the losses incurred during the financial crisis and currently trade higher than their 2007 credit bubble peak.
Source: Chart of the Day


