


| Source: Date: Updated: |
Chart of the Day
Thursday, May 9, 2013 Thursday, May 9, 2013 |
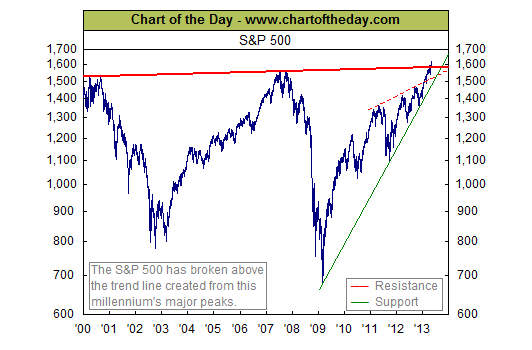
The US stock market continues to rally with the S&P 500 trading up 0.5% on the day. For some perspective on the trend of the overall stock market, today’s chart illustrates the trend of the stock market (as measured by the S&P 500) since 2000. As today’s chart illustrates, the post-financial crisis rally (which began in early 2009) has been significant enough to move the S&P 500 to all-time record highs. In addition, the latest leg of the post-financial crisis rally has the S&P 500 breaking above resistance created by the last two all-time record highs (see thick red line).
Source: Chart of the Day.

