Turnpage

Please visit our sponsors

RSS Feed
 

Current News & Press


Advertisement

The Bahamas Investor

News & Press Archives

 
The Bahamas Investor on facebookFollow The Bahamas Investor on TwitterSubscribe to RSS feeds from The Bahamas Investor
HOME > 
News & Press > 
Shanghai Composite Trend – chart

This chart illustrates the overall trend of the increasingly important Chinese stock market as measured by the Shanghai Composite Index. 

Source:
Date:
Updated:
Chart of the Day
Friday, February 21, 2014

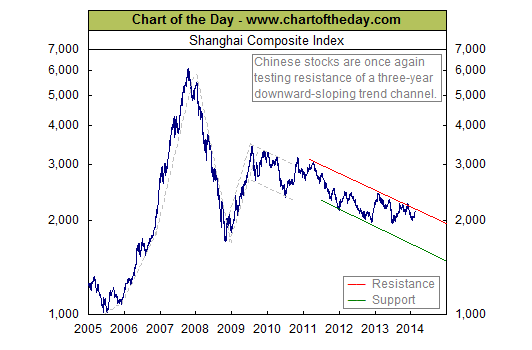
Today’s chart illustrates how the Chinese stock market went parabolic from mid-2005 until late 2007. China’s boom was immediately followed by a financial crisis induced bust with the Shanghai Composite Index plunging 72% in a little more than one year. Unlike what occurred stateside, China’s post-financial crisis rally was relatively short-lived (only nine months). Over the past three years, the Shanghai Composite Index has traded within the confines of a relatively steep downward sloping trend channel. Over the past month, the Shanghai Composite has worked its way higher to where it is testing resistance (red line) for the 7th time since early 2011.

Source: Chart of the Day.

The US Internal Revenue Service yesterday released a fact sheet on the last substantial package of regulations necessary for the implementation of the Foreign Account Tax Compliance Act. Download or view the fact sheet here.

Co-operation and integration are key to developing the Caribbean region's tourism product and ensuring greater visibility for the region as it attempts to target new markets. This was the message from a panel of sector leaders who met in Nassau last week for the Small Island Developing States conference.

The Bahamas Investor
Administrative Links


  © 2024 ETIENNE DUPUCH JR PUBLICATIONS LTD