Turnpage

Please visit our sponsors

RSS Feed
 

Current News & Press


Advertisement

The Bahamas Investor

News & Press Archives

 
The Bahamas Investor on facebookFollow The Bahamas Investor on TwitterSubscribe to RSS feeds from The Bahamas Investor
HOME > 
News & Press > 
Mid-term election year stock market performance – chart

This chart illustrates how the stock market has performed during the average mid-term election year. Since 1950, the first nine months of the average mid-term election year have tended to be subpar, which was then followed by a significant year-end rally. 

Source:
Date:
Updated:
Chart of the Day
Wednesday, January 8, 2014

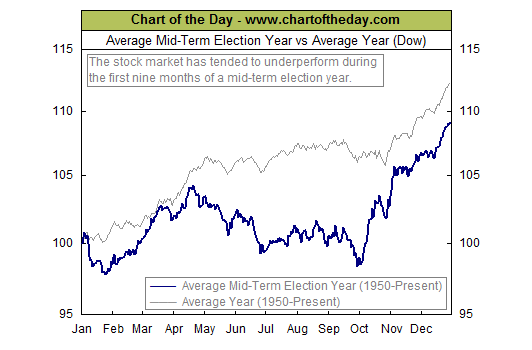
Today’s chart illustrates how the stock market has performed during the average mid-term election year. Since 1950, the first nine months of the average mid-term election year have tended to be subpar (see thick blue line). That subpar performance was then followed by a significant year-end rally. One theory to support this behavior is that investors abhor uncertainty. To that end, investors tend to pull back prior to an election when the outcome is unknown. Beginning in early October, however, the outcome of the election becomes increasingly apparent and investors respond by positioning their portfolios accordingly.

Source: Chart of the Day

The Ministry of Tourism has signed an agreement with the Miami Dolphins US football team to promote The Bahamas and sports tourism. Watch an interview with Minister of Tourism Obie Wilchcombe here.

Credit rating agency AM Best has affirmed the financial strength rating of A- (Excellent) and the issuer credit ratings of “a-“ for Cayman First Insurance Company and Bahamas First General Insurance. Both companies are subsidiaries of Bahamas First Holdings Ltd based in Nassau, The Bahamas.

The Bahamas Investor
Administrative Links


  © 2024 ETIENNE DUPUCH JR PUBLICATIONS LTD