


| Source: Date: Updated: |
Chart of the Day
Wednesday, April 24, 2013 Wednesday, April 24, 2013 |
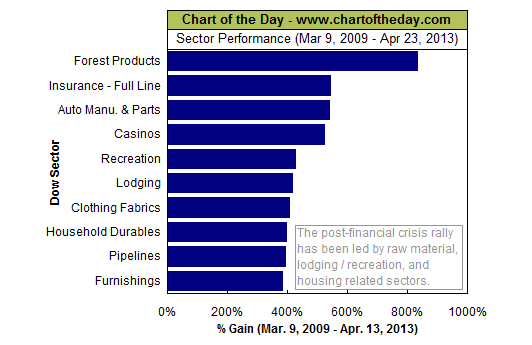
For some insight into the post-financial crisis rally, today’s chart presents the ten best performing Dow sectors (out of more than 100) since the market troughed on March 9, 2009. The outperformance of the ten sectors illustrated in today’s chart lend themselves to a few themes. First, raw materials (e.g. forest products and clothing fabrics) performed quite well due in part to the continuation of the rise of the rest. Also, recreation/lodging (e.g. casinos, recreation and lodging) proved to be a winning bet as the US economy slowly improved. Finally, housing related sectors (e.g. household durables and furnishings) proved to be a store of value as the housing sector found its footing. The performances of each of the sectors illustrated in today’s chart are especially compelling considering that the S&P 500 gained a relatively modest 133% during the same period.
Source: Chart of the Day

